Riya had just started her internship at a startup. On day one, her manager dropped a massive Excel sheet on her desk. “Can you turn this into something we can understand — like charts or a dashboard?” he asked. She opened her laptop and searched online. Two names popped up everywhere — Power BI and Tableau.
They both assured clean dashboards, smooth reports, and cool charts. But which one should she use?
Let’s break down what these tools are, what they do, and which one’s better for you.
What is Power BI?
Power BI is a business analytics tool from Microsoft. It helps you pull data from various sources, clean it, and turn it into visuals like charts, graphs, and dashboards.
It’s especially popular among people who use Excel regularly. Power BI connects smoothly with Excel files, SharePoint, and Microsoft’s cloud tools like Azure. If your team or company already uses Microsoft products, Power BI fits in naturally.
You can use Power BI to:
- Create dashboards from raw data
- Track business performance in real-time
- Share reports across teams
- Set up alerts and automated updates
It’s simple, fast, and beginner-friendly.
What is Tableau?
Tableau is another popular data visualization tool, owned by Salesforce. It’s known for its strong visual design, clean layout, and custom visuals.
While Power BI focuses on business users, Tableau is more suited for data analysts and designers who love visual storytelling. Tableau gives you more creative control — you can design dashboards exactly how you want them, with interactive filters, visuals, and animations.
You can use Tableau to:
- Handle large data sets smoothly
- Create highly customized visuals
- Connect with almost any database or cloud platform
- Tell a visual story through dashboards
It works well in industries where deep insights and custom reports matter — like healthcare, finance, or marketing.
Tableau vs Power BI: Key Differences
Here’s how they stack up across important areas:
| Feature | Power BI | Tableau |
|---|---|---|
| Ease of Use | Easier for beginners, Excel-like | Slightly steeper learning curve |
| Visual Quality | Clean visuals, limited design scope | Highly customizable, better design |
| Data Handling | Good with small to mid-size data | Excellent for large or complex data sets |
| Integration | Best with Microsoft tools | Works well across many platforms |
| Pricing | More affordable | More expensive |
| Performance | Great, but slows with very large data | Optimized for speed with big data |
| Community Support | Strong (Microsoft-backed) | Very active (Salesforce community) |
In short:
- Choose Power BI if you’re just starting, have a smaller budget, or use Microsoft products.
- Choose Tableau if you want top-tier visuals, work with large data, or need deep insights.
Features You Should Know
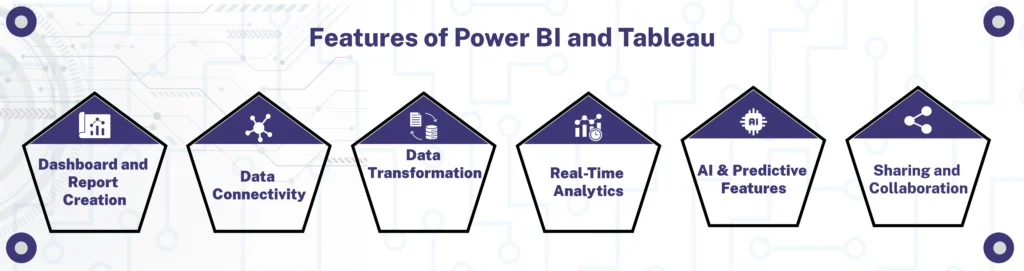
Here’s a list of features that both Power BI and Tableau offer — but with slight differences.
1. Dashboard and Report Creation
- Power BI: Easy drag-and-drop reports, templates, and real-time dashboards.
- Tableau: More advanced layout options and fine-tuned design control.
2. Data Connectivity
- Power BI: Connects to Excel, SQL Server, Azure, SharePoint, Google Analytics, etc.
- Tableau: Works with hundreds of data sources including cloud platforms like AWS, Google Cloud, and Salesforce.
3. Data Transformation
- Power BI: Comes with Power Query for cleaning and shaping data.
- Tableau: Has strong data prep tools with Tableau Prep Builder.
4. Real-Time Analytics
- Power BI: Allows real-time dashboards with auto-refresh from cloud sources.
- Tableau: Supports real-time updates too but may need more configuration.
5. AI & Predictive Features
- Power BI: Offers AI visuals and natural language queries.
- Tableau: Includes AI-powered insights and forecasting tools.
6. Sharing and Collaboration
- Power BI: Easy sharing within Microsoft Teams, Outlook, and Office.
- Tableau: Needs Tableau Server or Tableau Online to share securely.
So, Which One is Right for You?
If you’re a student, fresher, or a beginner in data:
Start with Power BI. It’s affordable, simple, and widely used in businesses.
If you’re planning to build a career in data analytics or business intelligence:
Learn both, but maybe start with Tableau if you want advanced visual design and work with big data.
Want to Learn Power BI and Tableau the Right Way?
At FACE Prep Campus, we guide students through hands-on projects in Power BI, Tableau, Python, and more. Whether you’re from a science, commerce, or management background — our industry-ready programs are designed to make you job-ready from day one.